


SBC Is Propping Up Adj. EBITDA
Many unprofitable companies are leveraging the use of stock-based compensation (“SBC”) when it comes to add-backs specifically geared towards improving overall adjusted EBITDA
This add-back can make many “unprofitable” companies look profitable (or less unprofitable) on a non-GAAP basis because accounting labels it as a non-cash expense
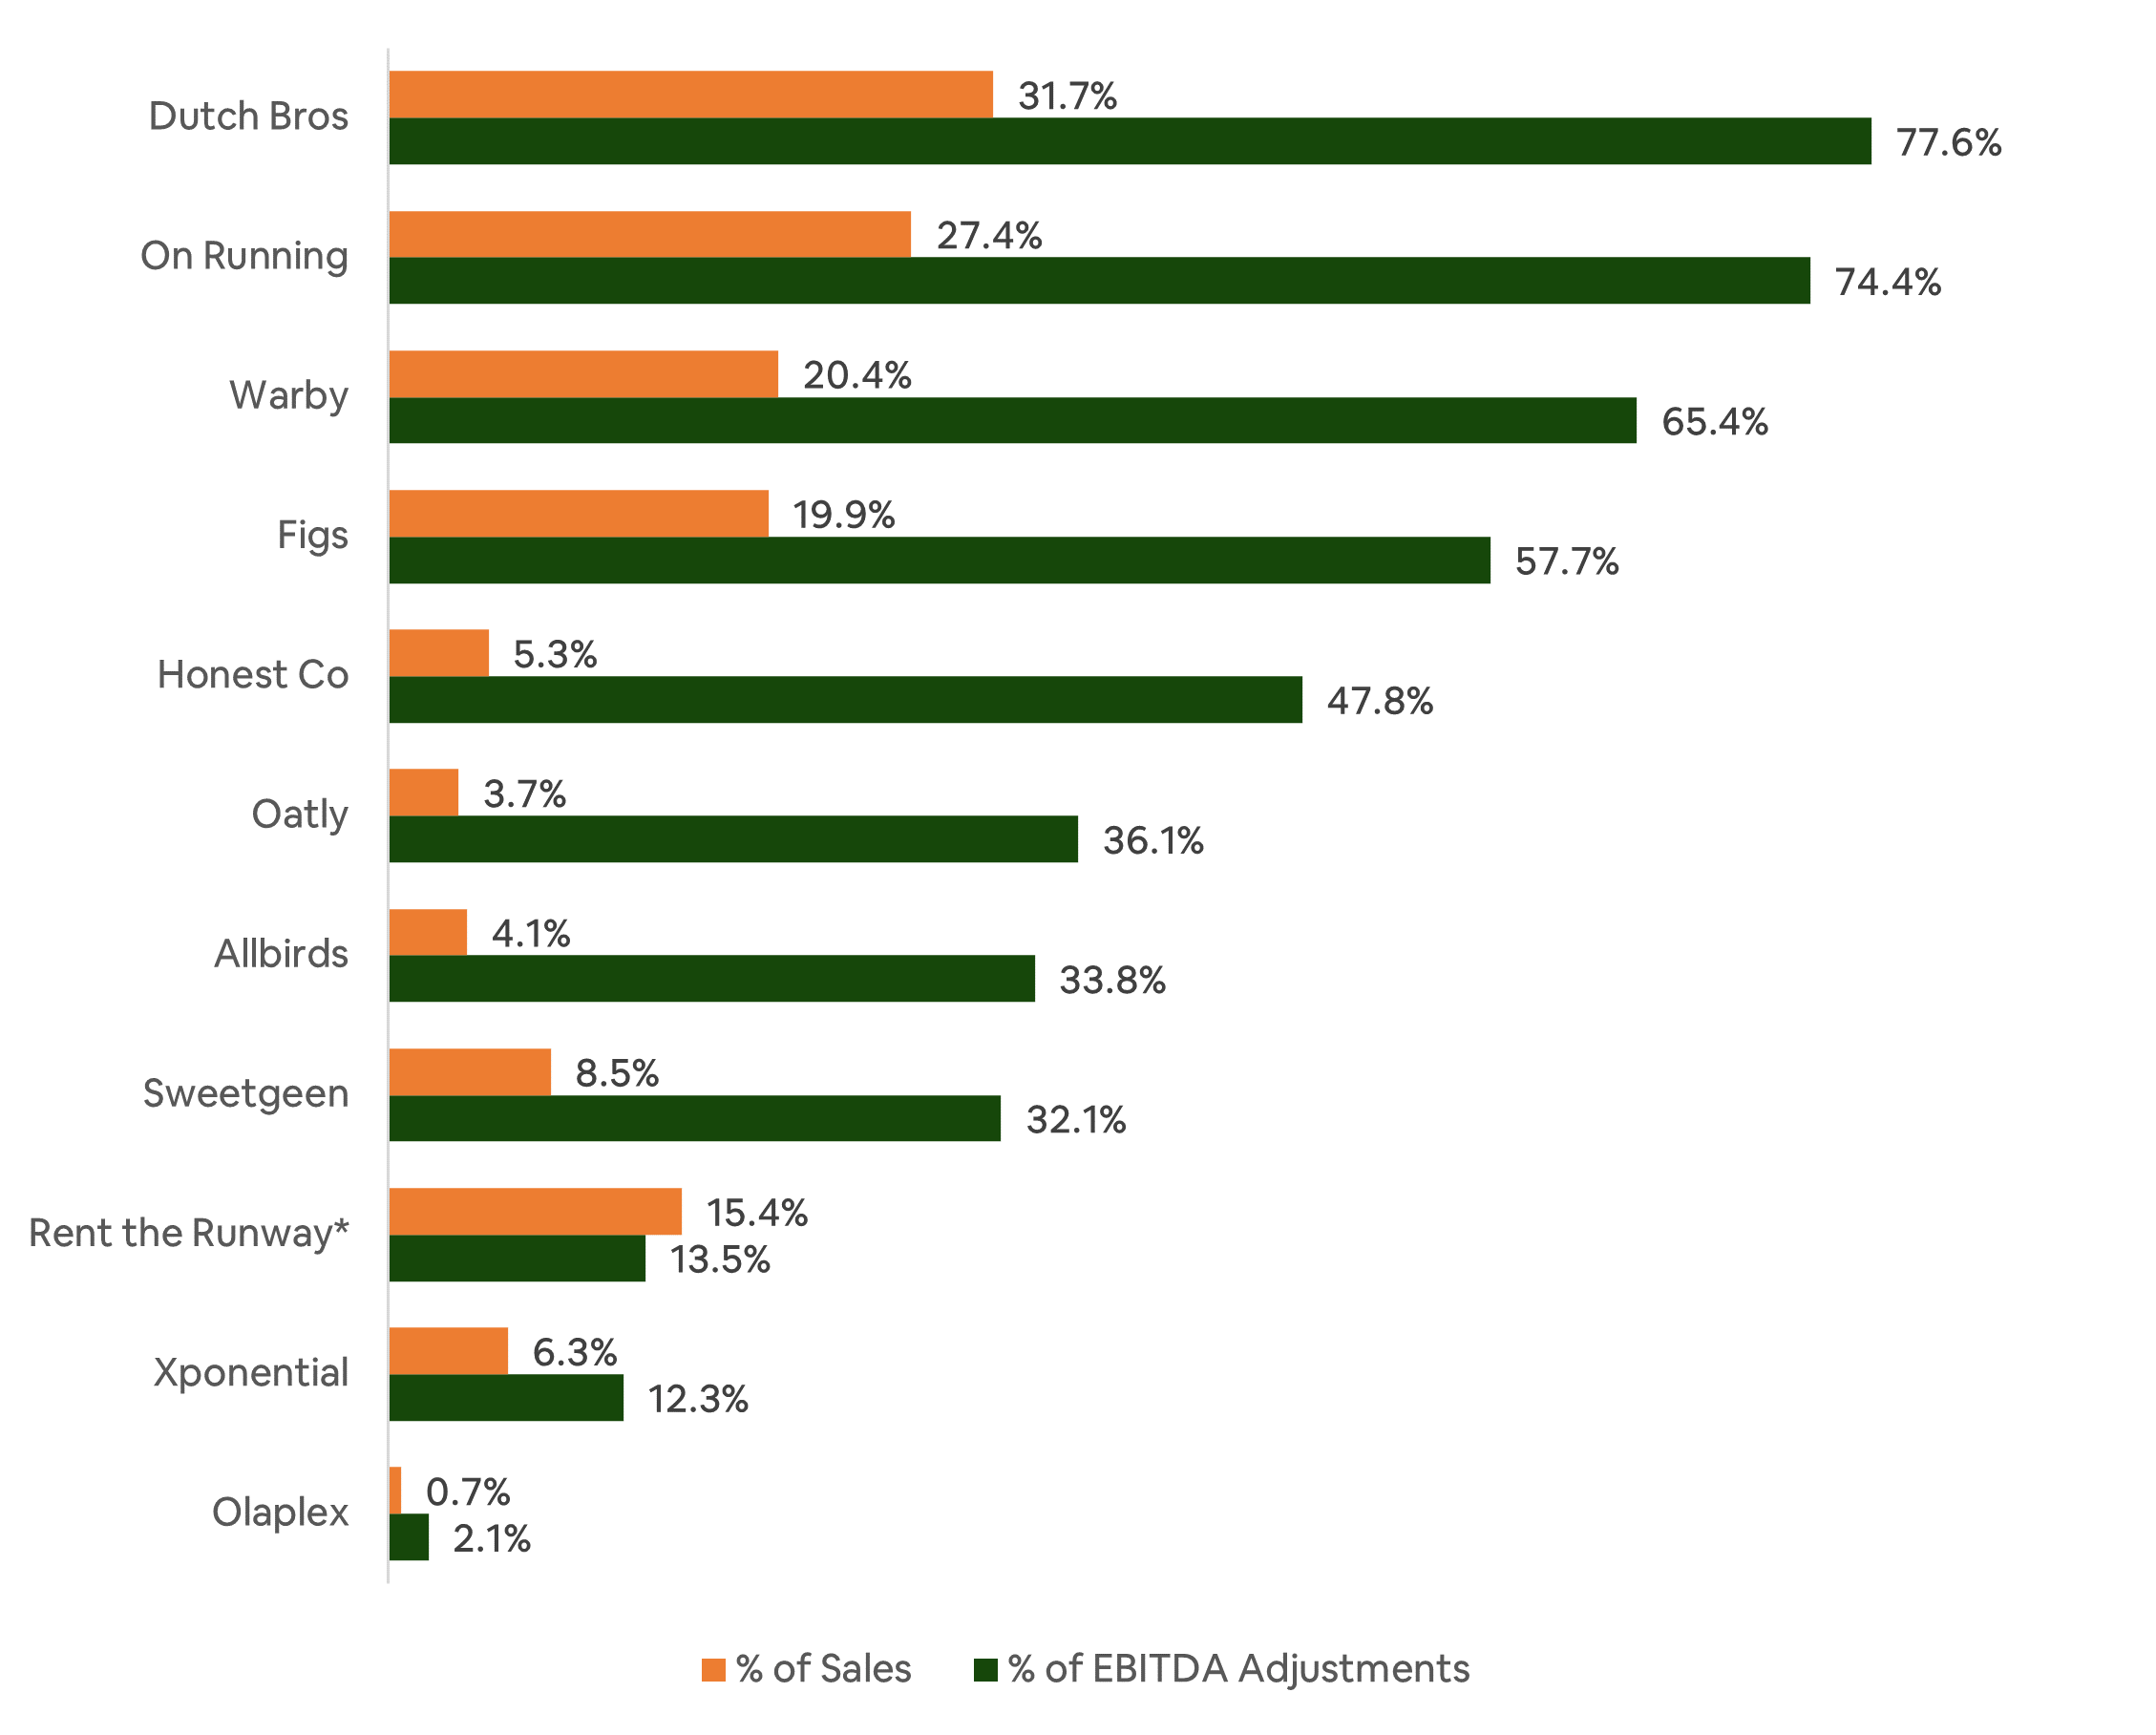
However, some companies are abusing this add-back and I wanted to show how bad by taking a few examples and showing how much SBC is as a percent of LTM sales and as a percent of total add-backs for adj. EBITDA1
It’s important to remember this chart example for two reasons:
Never take adj. EBITDA at face value because you don’t know what’s in it or what’s propping it up
While SBC technically doesn’t use cash, it does contribute to the dilution of a company’s market cap, which means you as an investor also get diluted
Example: Twitter TWTR 0.00%↑ went public in 2013 and while its market cap has almost doubled since then, the stock price has only risen by a mere +4.7% over the same time due to excessive use of SBC (as of 4.11.22)
Until next time,
Cedar Grove Capital
Got Feedback? Just Hit Reply
Twitter: @paulcerro
Disclosure: I/we currently have stock, option, or similar derivative position in Xponential Fitness (XPOF) and Warby Parker (WRBY) at the time of writing this article.
I wrote this article myself, and it expresses my own opinions. I am not receiving compensation for it. I have no business relationship with any company whose stock is mentioned in this article. This article is not meant to be taken as investment advice and you should do your own due diligence prior to taking any action.
Percent of total add-backs was calculated as company SBC divided by the total add-backs the company used in bridging net income(loss) to adjusted EBITDA.


SBC: This Is A Chart You Don't Want To Miss